04.10.2022 | Isabel Plana | News SLF
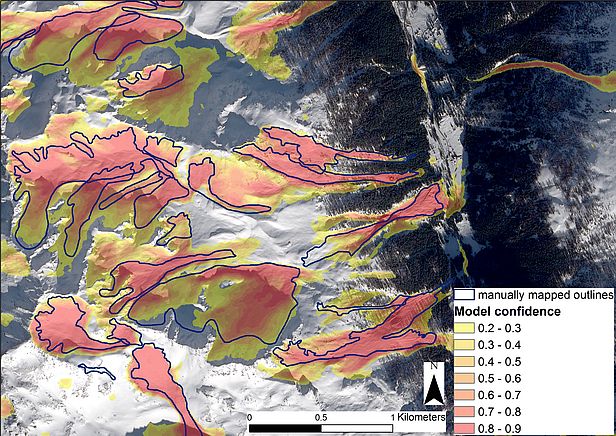
Satellite images give a large-scale picture of avalanche events. With a view to capitalising on this potential for monitoring purposes, researchers at the WSL Institute for Snow and Avalanche Research SLF have developed a method which can be used to automatically, quickly and reliably map avalanches in optical satellite images. They recently published their findings in the journal "The Cryosphere".
In what regions do avalanches repeatedly occur? Where are they triggered and what path do they take? How often do they happen and on what scale? All of these are key questions to be able to better assess the potential danger posed by avalanches and to optimise risk management. When analysing avalanches, a bird's eye view is particularly useful. "Satellite images are particularly valuable for us," says Elisabeth Hafner, who is doing her doctorate at the SLF, as part of the Alpine Remote Sensing group. "Unlike field visits or webcam or drone footage, they not only give an insight into parts of the mountain region but can also provide a large-scale picture of the whole Swiss Alpine massif."
However, not all satellite images are the same. Hafner and her colleagues are currently working on data from optical satellites. These are essentially photos of the kind that are familiar from Google Maps, for example. The images from the French satellite SPOT 6/7 used by SLF researchers for avalanche mapping have a resolution of 1.5 metres and provide very high levels of detail. "In optical satellite images of this type, we can see the complete outline of an avalanche, including the trigger location and type and the avalanche's course," explains Hafner. With this in mind, Hafner and her team decided to develop an image analysis method based on machine learning, which allows avalanches to be automatically identified and mapped in optical satellite images. Up to now, this has been laborious manual work: researchers have had to visually search the images on their screen for avalanches and manually trace their outlines.
Hafner did just that for satellite images from SPOT 6/7. The images are from 24 January 2018 and 16 January 2019 – both days for which the SLF had forecast the highest Avalanche Danger Scale level (5, i.e. 'very high'). Hafner combined the satellite images with a map of Switzerland and a digital terrain model to check whether an avalanche event in a specific area was at all plausible, given that avalanches occur almost exclusively on slopes that are steeper than 30°. In total, the researcher identified and mapped over 24,000 avalanches across the images from the two days. "On average, it took me around two minutes per avalanche, so I spent almost five weeks just looking for avalanches," laughs Hafner. "This shows how important it is to automate this process so that practitioners can analyse avalanche activity more quickly."

Manual mapping formed the basis for training the computer, or teaching it what was an avalanche in the images and what was not. Hafner resorted here to an established method, but adapted it in such a way that, in addition to the optical data, specifically the topographical information from the terrain model was processed. The assessment of the method ultimately resulted in an F1 score of 0.63, with a value of 1 meaning perfect reproducibility. "We weren't very happy with that at first, but we were only able to marginally improve the performance by making adjustments to the model." However, then the researchers thought: What if even experts don't always agree on the existence and outlines of avalanches?
So Hafner had a satellite image manually mapped by five avalanche experts and compared the correspondences between the mapping. It emerged that the correspondences were greater in sunny, clearly visible areas than those in the shade. Overall, the experts detected the same amount of avalanche area as the model. This demonstrates that the computer detects avalanches almost as reliably as multiple experts. As the next step in her research, Hafner will examine how such experts perform manual mapping and why they judge images differently in some cases. "If we understand these uncertainties, we'll be able to adjust our model accordingly. Our vision for the future is for the computer to quickly and consistently identify avalanches in optical satellite data and map them daily for the Swiss Alpine massif so that decision-makers have this important information to hand when they need it."
Original publication 
Contact 
Links 
First ever large-scale satellite detection of avalanches (News of 10.12.2019)
Copyright 
WSL and SLF provide the artwork for imaging of press articles relating to this media release for free. Transferring and saving the images in image databases and saving of images by third parties is not allowed.