The map contains all slope profiles and flat field profiles of the last 7 days which are available to the SLF.
Profiles on which one or more stability tests have been performed are assigned a stability status – good, fair and poor – according to the test results. If a variety of tests have been performed, the classification is based on the rutschblock test result. If several tests of the same type have been performed, the classification is based on the poorest test result. Profiles on which stability testing has not been performed are not classified.
Classification 
Classification takes place automatically according to the following criteria:
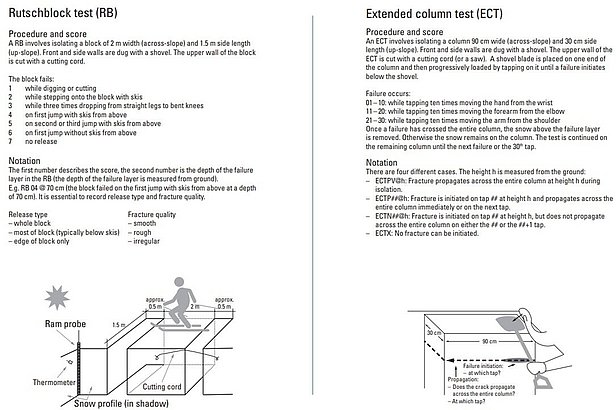
- Good (green circles): Rutschblock score 7 (RBNF), 6 or 5 with partial fracture and ECT with no fracture, no fracture propagation or only partial fracture propagation.
- Fair (orange circles): Rutschblock score 5 entire block, 4 or 3 with partial fracture and ECT with fracture propagation* across entire column width, but not before the 22nd tap (2nd tap from the shoulder).
- Poor (red circles): Rutschblock score 3 entire block, 2 or 1 and ECT with fracture propagation* across entire column width before the 22nd tap (2nd tap from the shoulder).
*the fracture propagation is only counted as such if the fracture arrives at the other end of the column at the same tap or highest one tap later.
Fractures in the top 10 cm are not taken into account for classification.
Informative value of the map 
The snow profiles map does not provide any information about spatial snowpack stability, but depicts a collection of snapshots. Snow profiles are the only means of obtaining a detailed picture of snowpack layering and bonding. In combination with one or more tests, they can be used to assess snowpack stability. When profiling the snowpack, it is important to select a representative site.
In view of the snowpack’s spatial variability, the information gathered from the profile can be applied to other slopes only with certain limits applied, even if a good site is selected.
When the local avalanche danger is being assessed, the information obtained from the snowpack must always be combined with other observations (natural warning signs, snow drift accumulations etc.).
Reading a snow profile 
Rutschblock and ECT 
The rutschblock (RB) test is the most reliable indicator of stability. SLF observers perform this test at slope profile sites as a general rule; sometimes they also conduct one or two extended column tests (ECT). The detailed instructions for a rutschblock and ECT are in the next image. Rutschblock and ECT testing furnishes information on how easily a fracture was initiated at the profile site and how well the fracture propagated. The test results are used to classify the snow profiles.
Temperatures 
The larger the temperature gradient (temperature change per metre) within the snowpack, the faster the relevant snow layers are transformed into faceted snow crystals.
Water can penetrate the snowpack to a significant depth only if the snow is (at least approximately) 0 °C ‘warm’ (zero degrees isothermal).
Ram resistance profile (general hardness pattern) 
The ram resistance profile is produced with a special instrument known as a ram penetrometer. The profile is an objective measure of layer hardness, but is unable to record thin weak layers. It measures the general strength or extent of bonding within the snowpack and assists in the assessment of the amount of snow that an avalanche can pick up in its path.
Hand hardness 
In addition, the hardness of the individual layers is manually determined. It is expressed by reference to the hand hardness scale: fist / 4 fingers / 1 finger / pencil / knife blade.

The criterion is the point at which hand or object can penetrate the snow layer after overcoming slight resistance. Intermediate scores (between two points on the scale) are also allowed. Although this measurement is less objective than the ram resistance profile, it records the hardness of thin weak layers as well.
Liquid water content (moisture) 
A mid-winter snowpack is typically colder than 0 °C and therefore dry. Only snow at the interface with the ground is often 0 °C ‘warm’ in this period as well. The scale that is used to describe the moisture is as follows:

From moisture code 3, the snowpack may contain free circulating water (funicular regime). The initial moistening of weak layers consisting of large grains is a particularly critical process as regards wet snow avalanches. If water seeps into the snowpack, it accumulates at the interface between fine and coarse-grained layers. This raises the water content at the layer boundary and appreciably reduces the strength of the snowpack.
Grain shapes and diameters 
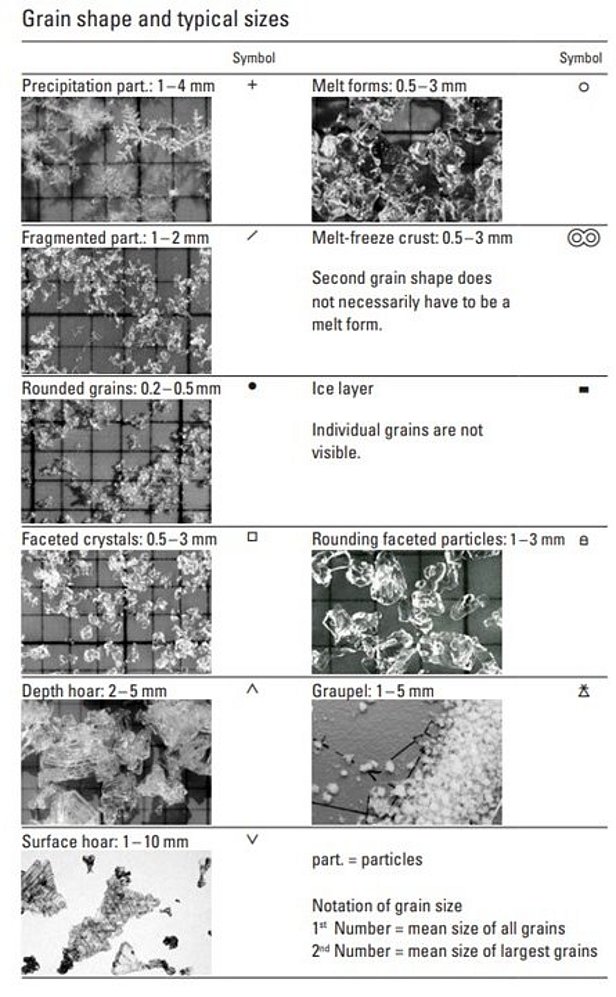
A visual inspection is performed with a magnifying glass to determine the grain shapes and diameters in each layer. Typical weak layers consist of large faceted grains, which generally do not bond together well. There is less bonding between faceted grains than between rounded grains, and less bonding between large grains than between small grains – measured by volume.
Lemons 
The ‘Lemons test’ is a method that examines structural characteristics to detect possible weak layers without performing conventional stability tests. The properties of both the layers and the layer boundaries are assessed. Each layer and layer boundary is examined for yellow flags in the categories itemised below. Each yellow flag is counted as a lemon.
Layer Properties 
- Large grains (≥ 1 mm)
- Soft layer (hand hardness index: 1, fist)
- Persistent grain shapes: faceted crystals, depth hoar or surface hoar
Interface properties 
- Large difference in grain size across interface (≥ 1 mm)
- Large difference in hand hardness index across interface (≥ 2 levels)
- Layer interface less than 1 m below the snow surface
Interpretation (Number of lemons in a layer / at an interface) 
- 5 – 6 lemons: very likely a critical weakness
- 3 – 4 lemons: possibly a critical weakness
- 0 – 2 lemons: no distinct weak layer, rather favourable snowpack structure


